|
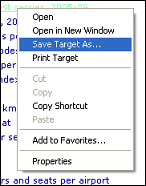
The following tables can be downloaded and contain information per individual low-cost carrier. Right click on a file and choose
‘Save Target As…’ to store the file on your computer. Tables are stored as tab delimited text files, *.txt,
and can be opened in MS-Excel.
Table I, Average distance per low-cost carrier, 2005-09.
Table II, Densities in seats per flight, 2005-09.
Table III, number of equipment types per carrier.
Table IIIb, legend equipment type codes.
Table IV, Average number of flights per carrier, 2005-09.
Table V, Airports, routes, and beta index, 2005-09.
Table VI, Gini index, 2005-09.
Table VII, Number of flights per 500 km.
Table VIII, Population density per seat.
Table IX, Gross domestic product per seat.
Table X, Number of tourists per seat.
Table XI, Statistics per country.
Tabel XII, Number of low-cost carriers and seats per airport.
Table XIIIb, Sorted on number of low-cost carriers.
Table XIV, European airports: primary, secondary, and tertiary.
|

|