To understand which analysis related to this research can be carried out with a GIS program, some more knowledge about GIS itself is needed. Hendriks and Ottens (1997) define GIS as follows: A geographical information system is “…a computer system which offers tools to structure, to save, to edit, to manage, to question, to analyse, and to visualize related spatial and non-spatial data, in such a way the data will offer valuable information to answer a certain policy or research question”. Depending on the context in which a GIS will be used, certain of the above mentioned aspects can be emphasized. In case of this research emphasis will be on visualizing and analyzing the data. The structuring, editing, and managing of the data will be done with help of MS Excel and SPSS before the data is entered into a GIS. With help of these two programs other calculations will be carried out which has been mentioned in the operationalization section. These calculations would require more work if they needed to be carried out in the used GIS programs.
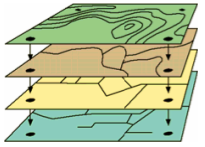
| Figure 21, Combined map layers |
|
| Source: unknown |
Data in a GIS can be divided into geometrical and attribute data. Geometrical data can be seen in a GIS in the shape of for example map data. Attribute data exists of datasets that can be coupled with the map data. In the final datasets different selections can be made, which can be visualized into different layers. (see figure 21). These different layers can be coupled with help of a key variable, this is a common variable which is available in the different layers. In this research the key variable is for example the airport code. Different coupled layers are for example borders, airports, and flight routes.