An aviation network differs from other transportation networks. For example an aviation network does not have a static, physical route structure compared to railway networks of which the existing railway infrastructure strongly determines the final railway network layout. Another difference is the spatial scale at which physical distance plays a role. Because of this tools for analyses like the shortest path analyses or gravity modelling are less relevant for aviation networks compared to other transportation networks.
In this research the GIS programs MapInfo and Flowmap are used. MapInfo is a GIS package that offers a wide range of tools, it only lacks specific network related tools. Flowmap is especially suitable for network analyses. Analyses related to carrier networks, the links, will be carried out with Flowmap. This involves mostly visualizing of selected and aggregated network data. Analyses related to airports, both site and situation, are carried out with MapInfo. Next to data visualizing other tools like buffer and overlay analyses will be used. This way a buffer for example can be created around an object and information can be gained of elements that are located within this buffer. This could be of use when analyzing landside accessibility and information is needed about the number of highway and railway nodes which are located within a certain distance of an airport.
In short the following analyses will be executed in a GIS when researching characteristics of the links. When adjustments and calculations of the data in Excel and SPSS have been completed, selected data will be implemented in Flowmap on different aggregation levels. Next the network data will be coupled with the airport database and networks can be visualized. After the data has been converted a few times, the network can be displayed proportionally, in which the number of seats on flights on a route determines the proportionality of the route. This process will be repeated for the total research period 1990-2005, resulting in a presentation of the network growth of the different low-cost carriers. With help of a GIS regions can be defined that will be used in determining network directions.
Site characteristics will be analysed with help of MapInfo. This way the percentage of low-cost carrier seats at an airport for example can be visualized proportionally and analysed. At a similar way a better understanding can be obtained which low-cost carrier types are dominant in certain regions.
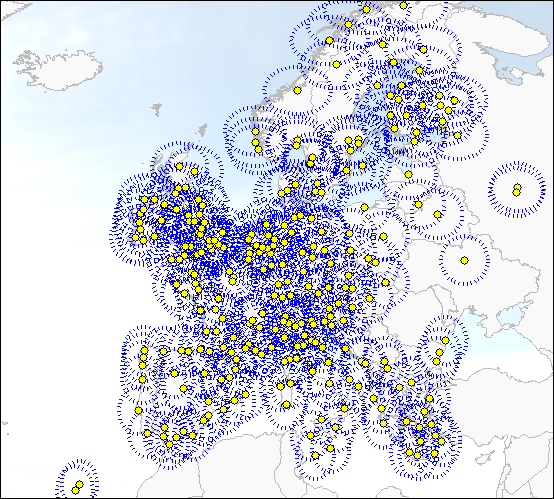
Different situation characteristics will be analysed by using a buffer analyses tool in MapInfo and combining different map layers. By implementing buffer zones of 200 kilometres around airport locations it will become possible to count the number of other potential competing airports, which are located within the 200-kilometre zone (see figure 23). This could be done for each low-cost carrier type.
| Figure 23, Buffer-zones around airports |
|