In transportation geography a mathematical representation of a transportation network structure can be given with help of graph theory. Because of the size and complexity of transportation networks it would be interesting to digitalize the network and edit it with help of a GIS program. Further selections are relatively easy made and analysed in a GIS. When GIS is used on a transport related subject one can speak of GIS-T, Geographic Information System for Transportation (Rodrique, 2006).
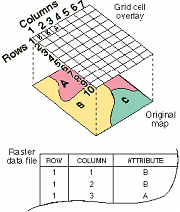
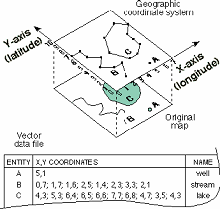
Data in a GIS can normally be visualized using two different methods (see figure 22). The first method is the raster model, in which each raster cel gets a certain value depending on what is found and needs to be visualized in the related area. A second method would be to visualize data through a vector model. With help of a x- and y-axis point locations can be described with coordinates. This last method is used in visualizing transportation networks, because this is relatively easy and more adjustable in the used GIS programs.
| Figure 22, Data representation models | |
| Raster model: | Vector model: |
|
|
| Source: unknown | |
When using transportation networks in a GIS-T two important tables are used. The first table contains information on the nodes. This table contains a unique value, which later can be used as a key variable, and the coordinates of the location of the node. In this research the key variable exists of the airport code consisting of three letters. With help of the airport coordinates, consisting of a longitude and latitude degrees, these nodes can be easily used in a GIS. The second table contains information about the links. This table also contains a unique value to identify each link separately. It also contains a key variable, which corresponds with the nodes table, and describes which nodes are connected with a link. With help of both tables a GIS can visualize and analyse the transportation network. Different variables can be added to these tables. Examples of common variables are the type of network (auto, rail etc.), costs (travel, time), and direction (one- or two-way traffic).
GIS-T studies can normally be divided into three categories (Rodrique, 2006). The first category includes studies that are doing research on data representation, which will look into how different data components of a transportation network can be integrated into a GIS. This can also involve methods to digitalize information from reality, for example a raster or vector model. The second category includes studies at analyzing and modelling possibilities of a GIS. Research will involve standard techniques that are offered by most GIS programs, for example data selection, geocoding, buffer, and overlay analysis. There are also more specialized techniques, which are offered in more specific GIS programs. Examples of these techniques are interaction modelling (gravity model), or catchment area analyses. The final category aims at the application side of GIS, examples are maintenance applications related to road surface, registering of traffic accidents, and traffic safety products (Rijnierse, 1999).