When researching the network development of low-cost carriers one should have a proper understanding on transportation network theory and their related research methods. Networks can be mathematical represented by a graph. This section will explain more about the graph theory related to transportation networks.
Ritsema van Eck (1993) defines a network as "a set of connections between locations, which enables transportation of persons, goods, energy, or information". Such networks can be mathematical represented by graphs. Graph theory is a mathematical specialisation, which researches how networks can be schematically represented and how their characteristics can be analysed (Rodrique, 2006). A graph exists of nodes and their connecting links.
In transportation geography most networks have a spatial dimension. One can distinguish between networks which are defined by their links, for example a highway or train network, and networks which are defined by their nodes, which can be the case in aviation networks.
These complexity costs consists of different characteristics of which the most import are summarized in the table below, related to full-service carriers.
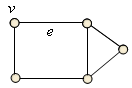
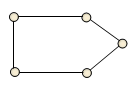
| Figure 5, Graph |
|
Figure 5 is a simple graph. A node (vertex) is represented by a 'v', and is for example an abstraction of an intersection, or airport. These nodes are connected by links (edges) represented by an 'e', and is for example an abstraction of a highway, or flight path.
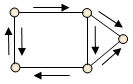
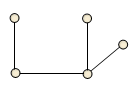
| Figure 6, Graphs | ||
| Directed | Path | Non-coherent |
 |
 |
 |
Different graph types can be identified. Figure 6 and 7 gives an overview of the different types. Direction has been taken into account in a directed graph. This is useful when representing one or two-way traffic. A path graph exists of multiple, connected links, which form a path, starting at the first, and ending at the last node. In case of a non-coherent graph different links aren’t connected to each other.
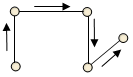
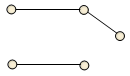
| Figure 7, Graphs | ||
| Circuit | Tree | Non-plane |
 |
 |
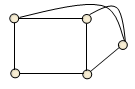 |
Are circuit is the result when the beginning and end point of a path are the same. The number of circuits is represented by a 'u'. If there are multiple circuits in a graph, there can be one fundamental circuit. A fundamental circuit is a circuit which does not contain any other circuit. A tree graph is the result when there is only one link between the different nodes. A tree graph contains as many links as nodes plus one (e = v – 1). Until now all links where represented plane. Normally an intersection is the result when links cross each other. When links do cross each other without creating an intersection a non-plane graph would be the result.
There are different simple measures and indexes which can be used as a tool to analyse networks. These different measures give a better understanding of the network structure of a graph. With the help of these measures different graphs can be compared to each other. It is also possible monitor the network development over a certain period of time.
The alpha index compares the existing number of circuits within a graph with the total of possible circuits. The greater the value of the index, the higher the connectedness of the network. Simple graphs, like a tree graph, have a value of zero.

and:
u = the number of circuits within a graph
v = the number of nodes within a graph
Another measure is the beta index. The beta index tells more about the connectivity of a graph by comparing the number of links with the number of nodes.

and:
e = the number of links within a graph
v = the number of nodes within a graph
The theta index compares the amount of traffic at a node. The greater the value of this index, the heavier the traffic at the nodes of the network.

and:
Q(G) = the total amount of traffic at a graph
v = the number of nodes within a graph
The eta index calculates the average length of a link in a network

and:
L(G) = the total length of a grap
e = the number of links within a graph
The gamma index compares the existing number of links with the total number of possible links. A high gamma value relates to a high connectivity of the network.

and:
e = the number of links within a graph
v = the number of nodes within a graph
Normally the characteristics of a low-cost carrier network structure relate to a static network. In reality networks are not static, but dynamic. Over time networks continually develop themselves. It would therefore be interesting to look at this time aspect when describing the network development.
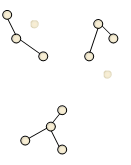
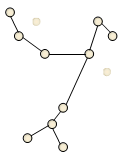
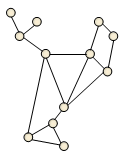
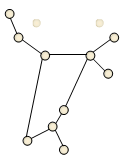
| Figure 8, Stages in network development | |||
| Local | Integration | Intensification | Selection |
 |
 |
 |
 |
| Source: Cox (2000), edited by author | |||
Cox (2000) distinguishes four stages in the development of a network (figure 8). In the local stage there are a couple of separate, local networks. In the integration stage new links are created which connect the separate networks and create one, large network. Next the connectivity of the network will increase in the intensification stage. The number of links increases, and the network itself will expand. In the selection stage some links will disappear, resulting (for the moment) in an optimal network. It is still unclear how the network development of a low-cost carrier looks like, and to which extend it will develop according to figure 8.