With links the low-cost carrier flight routes are meant. The following characteristics of the links are operationalized and analysed, and will subsequently be discussed (click on a link to jump to the related subject):
Table 4 shows for each low-cost carrier type the average distance per route (eta index) and the average distance per flight (frequency). The average distance is provided in minutes and in kilometres. It appears the LCC charter type has on average the largest distance per route and per flight. With the distance per route the average distance of a route between departure and destination point is meant, regardless the flight frequency on the route. Frequency is weighed in determining the average distance per flight. The results of the LCC full-service type and LCC original type do not differ that much. The LCC full-service type has on average a larger distance per route compared to the LCC original type. On the other hand the LCC original type has on average a larger distance per flight. The LCC full-service type network consists on average of longer routes compared to the LCC original type network, although this last type flies on average larger distances. The LCC regional type has the lowest average distances. Williams (2001) estimated the average travel time in Europe of low-cost carrier would be between 2 and 2,5 hours, full-service carriers would have a travel time around 3,5 hours. Based on the results of this research the average low-cost carrier value should be estimated lower. The gap of travel times between low-cost carriers and full-service carriers would therefore increase.
| Table 4, Average distances, links, 2005-09 | ||||
| LCC type | Eta (minutes) | Eta (kilometres) | Frequency (minutes) | Frequency (kilometres) |
| Charter | 174 | 1875 | 141 | 1446 |
| Full-service | 128 | 1200 | 106 | 924 |
| Original | 117 | 1040 | 110 | 947 |
| Regional | 86 | 669 | 77 | 566 |
| Source: OAG (2005) | ||||
The resulting values of the different low-cost carrier types correspond with the expectations based on the hypothetical model as discussed earlier. According to this model the LCC charter type operates on average at long distances, the LCC regional type operates on average at short distances. There is still no clear distinction between the LCC original and LCC full-service type, both values lay close to each other.
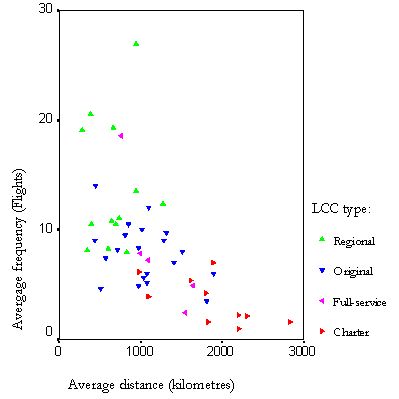
| Figure 24, Scatter diagram distances and flights, 2005-09 |
|
| Source: OAG (2005) |
The different carrier types are presented in a scatter diagram in figure 24. The y-axis represents the average flight frequency, the average distance in kilometres is represented with the x-axis. The earlier results are also visible in this diagram. The LCC regional type operates on short distances with a high frequency, the LCC charter type operates on long distances with a low frequency. The LCC original type fits in between.
Looking at the individual low-cost carriers (information can be found and downloaded in table I), most LCC charters have a larger average distance per flight compared to the top of the other carriers. The top ten carriers with large average distances per flight consists only of LCC charters with values from 1621 km to 2863 km, with exception of Sterling (1747 km), Flyglobespan (1692 km), both LCC original types, and Centralwings (1747 km), a LCC full-service type. Possibly these exceptions can be explained by looking at their geographical locations. Most flights departure from Scotland, Scandinavia, and Poland, all with tourist locations around the Mediterranean Sea.
Density is measured in this research by looking at the capacity of available seats per flight. Table 5 gives an overview of the average number of seats per flight for each low-cost carrier type. The LCC charter type clearly has the highest densities with an average of 187 seats per flight. The results of the LCC full-service and LCC original type are more close to each other with averages of 122 and 135 seats per flight. The LCC regional type has the lowest densities.
| Table 5, Average number of seats per flight, 2005-09 | ||||
| LCC type | Minimum | Maximum | Average | Standard deviation |
| Charter | 102 | 323 | 186,5 | 35,9 |
| Full-service | 46 | 184 | 122,2 | 41,3 |
| Original | 28 | 189 | 135,4 | 44,7 |
| Regional | 31 | 212 | 101,6 | 7,0 |
| Source: OAG (2005) | ||||
The network development from 1990 till 2005 has been visualized for each low-cost carrier and can be found here. The density is visualized with two variables, colour intensity and proportionality. The darker and broader routes indicate a high density in seats on the route.
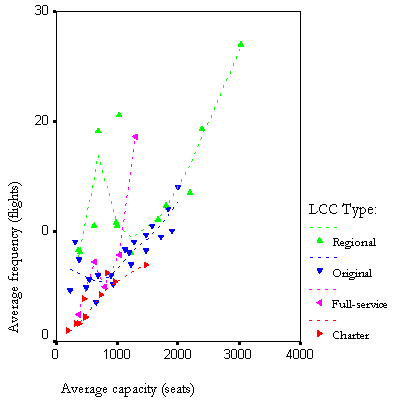
| Figure 25, Scatter diagram frequency and capacity, 2005-09 |
 |
| Source: OAG (2005) |
Figure 25 represents a scatter diagram of the different low-cost carrier types, in which the y-axis represents the flight frequency and the x-axis represents the average seat capacity. The LCC charter type has the lowest frequency with different capacities, the LCC regional type has the highest frequency, and the LCC original type lies in between.
When looking at low-cost carriers individually (information can be found and downloaded here) the average capacity per route differs strongly for each carrier. It is unclear what could be an explanation of this difference, it appears there is no relation with the size of the network, but the LCC regional type has the highest average per route and the LCC charter type the lowest average. The averages per flight give a more clearly image, they confirm the earlier observations and correspond with the hypothetical model: the LCC charter type operates with larger aircrafts with a high capacity of seats.
One characteristic of low-cost carriers is that they operate with one aircraft type. By focusing on one aircraft type costs can be reduced on areas like maintenance and crew can be used more flexible because they only need to know how to operate one aircraft type.
| Table 6, Number of aircraft types, 2005-09 | ||||
| LCC type | Minimum | Maximum | Average | Standard deviation |
| Charter | 1 | 8 | 3,4 | 2,32 |
| Full-service | 2 | 3 | 2,4 | 0,55 |
| Original | 1 | 3 | 1,5 | 0,69 |
| Regional | 1 | 7 | 2,4 | 1,74 |
| Source: OAG (2005) | ||||
Table 6 gives an overview of the number of different aircraft types for each low-cost carrier type. Information for each individual carrier can be found here (information can be found and downloaded here). On average the LCC charter type operates with the highest number of different aircraft types. The LCC original type has the lowest average of 1,5 aircraft types per carrier. The statement that low-cost carriers with only one aircraft type appears incorrect. Especially the larger low-cost carriers operate with multiple aircraft types.
The next tables give information about the frequency of the different carriers measured in number of flights. Table 7 contains information on the total number of flights per carrier and gives an indication of the total size of the different LCC types. Interesting is the average total of flights per carriers, it appears the LCC original type has the highest frequency of 878 flights in the first week of September 2005. The LCC charter type has an average of 443 flights per carrier, almost half of the original type.
| Table 7, Number of flights per carrier type, 2005-09 | |||||
| LCC type | Minimum | Maximum | Total | Average | Standard deviation |
| Charter | 4 | 1972 | 4426 | 442,6 | 600,9 |
| Full-service | 178 | 822 | 2730 | 546 | 245,1 |
| Original | 54 | 4849 | 19311 | 878 | 1516,8 |
| Regional | 50 | 1786 | 8247 | 589 | 580,6 |
| Source: OAG (2005) | |||||
The average number of flights per route for each LCC type is given in table 8. The LCC charter type has the lowest flight frequency per route. The LCC full-service and LCC original type have values around 8 per route. The LCC regional type has the highest flight frequency
| Table 8, Average number of flights per carrier type, 2005-09 | ||||
| LCC type | Minimum | Maximum | Average | Standard deviation |
| Charter | 1 | 7 | 3,5 | 2,01 |
| Full-service | 2 | 19 | 8,2 | 6,46 |
| Original | 3 | 14 | 8,1 | 2,77 |
| Regional | 8 | 27 | 13,5 | 5,8 |
| Source: OAG (2005) | ||||
The frequencies of the LCC charter and LCC regional type correspond with expectations of the hypothetical model, in which the LCC charter type has a low flight frequency and the LCC regional type has a high flight frequency. Related to the previous results, the LCC charter type has a low frequency, and operates with large aircraft with a high capacity on long distances. The LCC regional type flies frequent, and operates with smaller aircraft with a low capacity on short distances. Although the results of the LCC full-service type and LCC original type lay close to each other, the LCC full-service type has a relatively high standard deviation. This relates to the fact that the LCC full-service group consist of only five carriers and is therefore more sensitive for extremes. At the individual carrier level (information can be found and downloaded here) it appears that Blue1, a LCC full-service carrier, has a high average frequency of 19 flights. If Blue1 would have been left out, the resulting values of the LCC full-service type would correspond more with the LCC charter type.
To get an indication of the connectivity of the low-cost carrier network, the number of routes within a network will be analyzed. The average number of routes per airport can be calculated with the beta index.
| Table 9, Routes per carrier type, 2005-09 | |||||||
| LCC type | Minimum | Maximum | Total | Average | Standard deviation | Beta | Airports |
| Charter | 4 | 462 | 1276 | 128 | 157 | 3,83 | 23 |
| Full-service | 38 | 108 | 391 | 78 | 29 | 2,99 | 28 |
| Original | 6 | 440 | 1538 | 92 | 131 | 2,70 | 22 |
| Regional | 6 | 162 | 638 | 46 | 50 | 2,70 | 15 |
| Source: OAG (2005) | |||||||
Table 9 gives an overview of the minimum, maximum, total, average, standard deviation, and beta index of the number of routes per carrier. The last column represents the average number of airports per carrier. The high beta value of the LCC charter type indicates they have on average the highest number of routes per airport and has therefore the highest connectivity. Beta values of the remaining types lay close to each other. When looking at the average number of route per carrier, both the LCC original and LCC charter type have high standard deviations of 157 and 131 routes, which makes it difficult to formulate general conclusions. A better understanding can be obtained when looking on a lower aggregation level at the different individual low-cost carriers.
Information on the number of routes, the number of airports, and the beta index of individual carriers can be found here (information can be found and downloaded here). With a few exceptions like Transavia and Germanwings, it appears larger low-cost carrier networks, measured in number of flights, have higher beta values, and therefore have a high network connectivity. In the hypothetical model connectivity increases when the network develops itself, this corresponds with the results. Generally speaking low-cost carriers with large networks exist longer compared to carriers with a small network and have a high connectivity. This will be discussed more thoroughly when analyzing the network development.
The concentration can be analyzed with help of the Gini index. If all traffic is divided equally over the network, the index will have a value of 0. A higher value indicates a more unequal divided traffic over the network. Table 10 gives an overview of the Gini index aggregated at the low-cost carrier type level. It appears there is relatively no difference between the number of seats and number of flights. The LCC charter and LCC regional appear to have a relatively similar traffic dispersion over the network. The LCC original type has a more unequal traffic dispersion, followed by the LCC full-service type.
| Table 10, Gini index, 2005-09 | |||||||
| LCC type | Routes | Flights | Seats | ||||
| Charter | 0,38 | 0,49 | 0,49 | ||||
| Full-service | 0,47 | 0,59 | 0,59 | ||||
| Original | 0,40 | 0,52 | 0,52 | ||||
| Regional | 0,38 | 0,49 | 0,49 | ||||
| Source: OAG (2005) | |||||||
To get a better understanding of the relation between a high Gini index and the spatial network of a carrier the network and Gini index of the number of seats of First Choice Airways and Norwegian Air Shuttle are presented in figure 26. First Choice Airways is a LCC charter type and has a Gini index of 0,33 which indicates a relatively equal dispersion of seats over the network. The map shows an equal dispersion of seats over the different routes. Norwegian Air Shuttle, a LCC original type, has much smaller routes of which a few have a high seat density. This is also indicated in the Gini index of 0,75, which is almost twice the value of First Choice Airways.
| Figure 26, Network First Choice Airways | Network Norwegian Air Shuttle | ||||||
| Both maps display the network of September 2005, click to launch related network viewer. | |||||||
 |
 |
||||||
| Gini index = 0,33 | Gini index = 0,75 | ||||||
| Source: OAG (2005) | |||||||
Gini indexes of individual carriers can be found here (information can be found and downloaded here). By comparing the Gini index with the visualized network development of the related a carrier a better understanding of the dispersion of traffic over the network can be obtained. The individual network development can be found here. The Gini index of flight frequency and Gini of the number of seats is almost similar, which indicates the dispersion of flights is almost the same as the dispersion of seats.
The low-cost carrier network development will be analyzed by looking at selected characteristics during the time span 1990 � 2005, aggregated at the level of LCC type. The following characteristics are selected: number of seats, gamma, beta, theta, and eta index. Network development at the individual carrier level can be found here.
While interpreting the diagrams one should know data is lacking from 1994 and from 2000 till 2002. During 2003 � 2005 most low-cost carriers where active and most data was available.
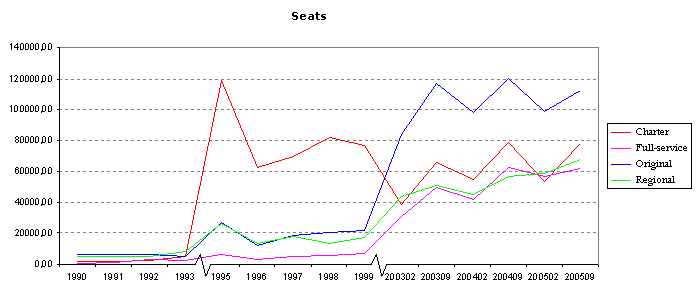
| Figure 27, Capacity development |
 |
| Source: OAG (2005) |
Figure 27 shows the development of the seats capacity during a selected week in the related year. The last three years present data in February and September. The arrival of the low-cost carrier in Europe is clearly visible in this diagram, in which the market is dominated by the LCC original type.
While interpreting the diagrams one should know data is lacking from 1994 and from 2000 till 2002. During 2003 � 2005 most low-cost carriers where active and most data was available.
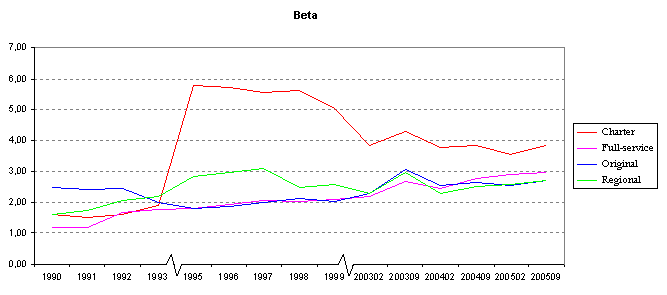
| Figure 28, Connectivity development, beta index |
 |
| Source: OAG (2005) |
The beta index is a measure for connectivity of which the development is presented in figure 28. A High beta value indicates there are more routes on average at an airport, which results in a larger overall connectivity of the network. Because the average number of airports per low-cost carrier type lies relatively close to each other compared to the number of routes (see table 9), the final beta index is influenced by the number of routes. During the whole period it appears the LCC original and LCC full-service type lay relatively close to each other. From 2003 the LCC regional type follows the other two types. All three types have an average of almost three routes per airport in the last years. The beta index of the LCC charter type decreases from 1995 and has an average of almost four routes per airport in the last years. It can be concluded the connectivity of the LCC charter type has decreases. The connectivity of the other three types has increased and has all an average of three routes per airport.
| Figure 29, Development low-cost traffic per airport |
 |
| Source: OAG (2005) |
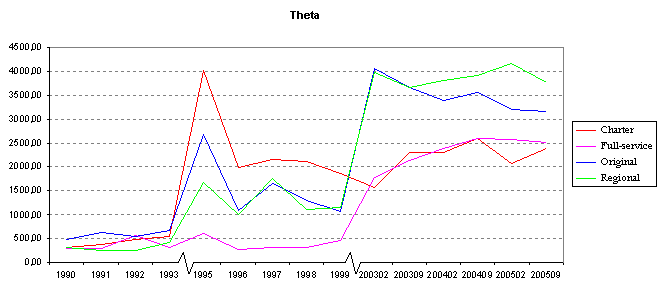
The development of the theta index is presented in figure 29 and gives an overview of the traffic development per airport of each low-cost carrier type. The index values of the LCC regional and LCC charter type differ much. The LCC regional type ends with most traffic per airport, followed by the LCC original type. The LCC charter type started with most traffic per airport and ends at almost the same level as the LCC full-service type.
| Figure 30, Development average route distance |
 |
| Source: OAG (2005) |
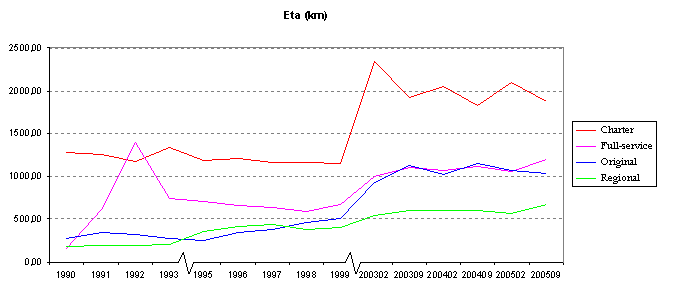
Figure 30 represents the development of the average distance per route which is calculated with the eta index. The LCC charter type has on average the longest distance per route and over time slowly decreased to the level of the other three types. The LCC regional type has on average the shortest distance per route, which slowly increased to the other types. Although the average distance per route of all types in the last three years is relatively consequent, the distances of the LCC full-service, LCC regional, and LCC original type slowly increased during the whole period. The three types started flying on average longer distances.
| Figure 31, Connectivity development, gamma index |
 |
| Source: OAG (2005) |
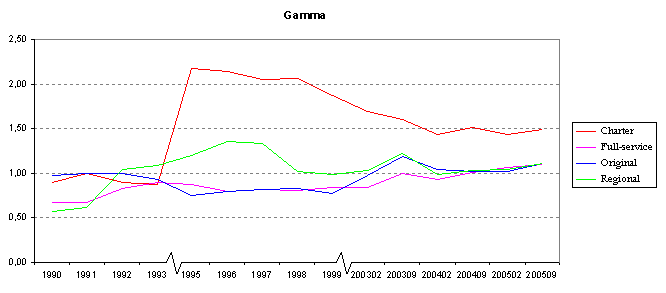
Another measure for connectivity is the gamma index which is given in figure 31. The gamma index compares the number of realized routes with the number of possible routes within a network. A high value indicates a larger connectivity. The results of this index differs not much compared to the beta index, the LCC charter type has the highest connectivity, in the end the remaining three types all have the same connectivity value.
To analyze if networks of low-cost carrier types have a certain geographical direction five regions will be defined based on the historic spatial development (see figure 3) and geographical location of the regions. The number of tourists is also taken into account when defining the regions, this was for example crucial in defining region C, Southern Europe. The five regions create 25 possible directions which could exist within a network. For each low-cost carrier type the number of seats has been used as the weight of a direction13.
| Figure 32, European regions |
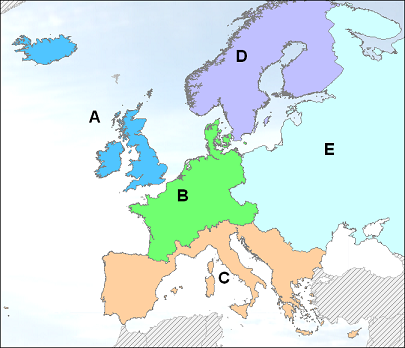 |
Figure 32 gives an overview of the five regions. Region A represents Great Britain and Iceland. The main continent has been divided into West, East, North, and South Europe. The tourist French regions, laying at the Mediterranean Sea have been classified into the Southern Europe region (see figure 14 for the number of tourists per region). Below the results for each low-cost carrier type will be discussed. Because most flights are return-flights the amount of traffic which flies one direction will be almost the same as the number of flights in the opposing direction.
| Table 11, LCC charter, percentage seats per direction, 2005 | |||||
| Direction | A | B | C | D | E |
| A | 0,0 | 4,5 | 5,1 | 0,0 | 0,1 |
| B | 4,5 | 10,0 | 28,3 | 0,2 | 1,0 |
| C | 5,1 | 28,4 | 6,7 | 1,1 | 0,9 |
| D | 0,0 | 0,2 | 1,1 | 0,0 | 0,4 |
| E | 0,1 | 1,0 | 0,9 | 0,4 | 0,0 |
Table 11 relates to the LCC charter type and gives an overview of the percentage seat capacity for each direction. Direction C-B, 28,4% and direction B-C, 28,3% are the most dominant directions, followed by direction B-B, 10,0% and C-C, 6,7%. The LCC charter type is strongest represented on the direction between West Europe and the more touristy South Europe. There are almost no directions to North and East Europe.
| Table 12, LCC full-service, percentage seats per direction, 2005 | |||||
| Direction | A | B | C | D | E |
| A | 19,9 | 2,4 | 5,7 | 0,0 | 1,1 |
| B | 2,4 | 2,8 | 13,3 | 3,0 | 2,3 |
| C | 5,7 | 13,3 | 0,4 | 0,0 | 1,8 |
| D | 0,0 | 3,0 | 0,0 | 12,9 | 1,5 |
| E | 1,1 | 2,3 | 1,8 | 1,5 | 1,6 |
A different image appears when looking at the LCC full-service percentages in table 12. Most traffic is located within region A, 19,9 %, followed by C-B and B-C with both 13%. Region D, Scandinavia, has a percentage of 12,9%. Because of the small number of LCC full-service carriers a few carriers can create a relatively large percentage in a certain direction. The network of Blue1 is responsible for the high percentage D-D.
| Table 13, LCC original, percentage seats per direction, 2005 | |||||
| Direction | A | B | C | D | E |
| A | 21,2 | 4,5 | 14,1 | 2,8 | 1,2 |
| B | 4,5 | 2,4 | 3,4 | 1,3 | 0,7 |
| C | 14,1 | 3,4 | 7,1 | 1,4 | 0,8 |
| D | 2,8 | 1,3 | 1,4 | 7,9 | 0,5 |
| E | 1,2 | 0,7 | 0,8 | 0,5 | 0,3 |
Just like the LCC full-service type the percentages of the LCC original type as seen in table 13 are mostly located within region A, 21,2%. Direction A-C and C-A amount both 14,1%. The remaining directions are compared to the other directions divided almost equally. The reason behind the dominancy of direction A-A can be possibly explained with the historical development of low-cost carrier in Europe, which started in Great Britain, and in which still most low-cost carriers are active.
| Table 14, LCC regional, percentage seats per direction, 2005 | |||||
| Direction | A | B | C | D | E |
| A | 13,8 | 4,5 | 1,6 | 0,0 | 0,0 |
| B | 4,4 | 15,7 | 2,7 | 1,2 | 0,0 |
| C | 1,6 | 2,7 | 40,9 | 0,5 | 0,0 |
| D | 0,1 | 1,4 | 0,4 | 8,1 | 0,5 |
| E | 0,0 | 0,0 | 0,0 | 0,0 | 0,0 |
Table 14 gives an overview of traffic on different directions of the LCC regional type. Most traffic takes place within the defined regions, there is relatively less traffic between the different regions. Most dominant is direction C-C with 40,9%, followed by B-B with 15,7 %, and A-A with 13,8%.
In conclusion the different directions differ for each low-cost carrier type. The hypothetical model states the LCC charter type would have a North South direction, this corresponds with the results. The dominant directions are summarized in table 15.
| Table 15, Dominant direction per type, in percentage seats, 2005 | |||||
| LCC type | >20% | 20% - 15% | 15% - 10% | ||
| Charter | B-C, C-B | ||||
| Full-service | A-A | B-C, C-B, D-D | |||
| Original | A-A | A-C, C-A | |||
| Regional | C-C | B-B | A-A | ||
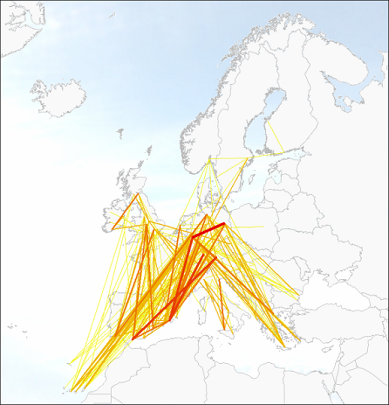
From figure 33 can be concluded there is a high potential of competition between individual low-cost carriers. This figure visualizes the number of doubling routes between the low-cost carriers, in which there is a maximum of 7 low-cost carriers that are active on the same route. Most doubling low-cost carriers compete with carriers of the same LCC type. The LCC charter type has the highest number of doubling routes, followed by the LCC original type.
| Figure 33, Doubling low-cost carrier routes, 2005-09 |
 |
| Source: OAG (2005) |